| |
Date: Tue 27 Feb 16:26:12 EST 2007
From: "Uros Midic" <uros@divac.ist.temple.edu> Add To Address Book | This is Spam
Subject: cis601, hw5 (week 6), uros midic
To: <lakamper@temple.edu>
Cc: "'Uros Midic'" <uros@divac.ist.temple.edu>
Dr Lakaemper,
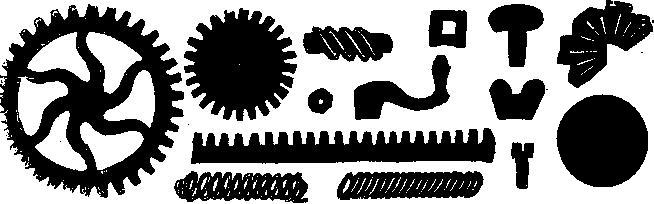
Here is my solution for this week’s homework. I use one
method to obtain a 1D signal from a figure. Then I apply FFT, ignore
frequencies 0 and 1, and find the most dominant frequency greater or equal to
2. If this is smaller than 6, I assume that the figure is not a gear. Otherwise
the most dominant frequency (i.e. the frequency with highest amplitude) is (an
estimate of) the number of gears. Than I use another method to obtain a 1D
signal and repeat the same procedure with FFT to get another estimate of the
number of gears.
The first method is to use the index in the boundary points
sequence as the independent variable, and the distance from the center point as
the signal.
The second method is to find the mean value of the distance
from the center point, draw a circle around the center point with this mean as
the radius, and track whether points on the circle are white or black.
To avoid certain problems, the center is not determined as the
centroid of the boundary, but as the center of the bounding rectangle of the
figure.
I also added an additional figure that illustrates some
problems with the second method.
Uros Midic
uros@ist.temple.edu
Phone
+215.204.5908
FAX
+215.204.5082
Temple University, 303A Wachman
Hall, 1805 N. Broad St.,
Philadelphia, PA
19122
Attachment: hw5.m (4k bytes) Open
im = imread('objects.jpg');
im = mat2gray(im);
im = im(:,:,1);
bw = im<0.5;
% add one more figure with 11 teeth (9 of which are smaller)
imsize2 = size(bw,2);
bw(:,imsize2+[1:200]) = 0;
an = (0:0.0005:0.9995)*2*pi;
p34 = round(length(an)*3/4);
ind = 1:p34;
r(ind) = sin(an(ind)*6).^2;
ind = (p34+1):length(an);
r(ind) = sin(an(ind)*4).^2;
r = r*20 + 70;
x = r.*cos(an) + 100 + imsize2;
y = -r.*sin(an) + 100 ;
x = round(x); y = round(y);
ind = y-1 + (x-1)*size(im,1);
bw(ind) = 1;
bw = imfill(bw,[100 imsize2+100]);
% added one more figure
se = strel('disk',1);
bw1 = imclose(imdilate(bw,se),se);
bw2 = imfilter(bw, fspecial('gaussian',1));
l = bwlabel(bw1,8);
gearind = [];
gearno1 = [];
gearno2 = [];
for i=1:max(l(:))
fig = l==i;
disp(['Cluster #',int2str(i),', area=', int2str(sum(fig(:))),' pixels'])
if sum(fig(:)) < 20
disp('... cluster too small, skipping')
continue
end
pointind = find(fig,1);
pointi = mod(pointind-1,size(fig,1))+1;
pointj = floor((pointind-1)/size(fig,1))+1;
b = bwtraceboundary(fig,[pointi pointj],'NE');
%c = mean(b,1);
c = mean([min(b(:,1)) min(b(:,2)); max(b(:,1)) max(b(:,2))]);
b = b - repmat(c,[size(b,1) 1]);
signal = sqrt(sum(b.^2 , 2));
f = fft(signal);
fhalf = round(length(f)/2);
[m, maxi] = max(abs(f(3:fhalf)));
maxi = maxi+1; % +2 because selection started from 3,
%
-1 because of the +1 shift in matlab
disp(['Dominant frequency (excluding 0 and 1) = ',int2str(maxi)]);
gearind = [gearind i];
if maxi<=5
gearno1 = [gearno1 maxi];
gearno2 = [gearno2 0];
continue
end
gearno1 = [gearno1 maxi];
signal2 = zeros(1,1000);
an = [0:0.001:0.999]*2*pi; meanr = mean(signal);
circlei = round(c(1) + sin(an)*meanr);
circlej = round(c(2) + cos(an)*meanr);
circlei = max(min(circlei, size(fig,1)),0);
circlej = max(min(circlej, size(fig,2)),0);
for j=1:1000
% signal2(j) = fig(circlei(j),circlej(j));
% signal2(j) = bw(circlei(j),circlej(j));
% signal2(j) = bw1(circlei(j),circlej(j));
signal2(j) = bw2(circlei(j),circlej(j));
end
f2 = fft(signal2);
f2half = round(length(f2)/2);
[m, maxi] = max(abs(f2(3:f2half)));
maxi = maxi+1; % +2 because selection started from 3,
%
-1 because of the +1 shift in matlab
gearno2 = [gearno2 maxi];
end
subplotn = ceil(sqrt(length(gearind)));
for i=1:length(gearind)
subplot(subplotn,subplotn,i);
fig = l==gearind(i) & bw;
imshow(fig(find(sum(fig,2)>0),find(sum(fig,1)>0)));
if gearno2(i)==0
t = ['Dominant frequency (excluding 0 and 1) is ',int2str(gearno1(i)),'.'];
else
t = [' This is probably
a gear with ',int2str(gearno1(i)),' (or ',int2str(gearno2(i)),'??)
teeth.'];
end
title(t);
end
Attachment: objects.jpg (47k bytes) Open
|